R Shiny Application
An R shiny application is created from results of the MetaFunc run. The homepage of the application is shown as follows:

Fig. 2 R Shiny Homepage
Usage
Note
RStudio is needed to launch the visualisation application.
The MetaFunc repository comes with a metafunc-shiny directory that contains all the dependecies of the application. The MetaFunc pipeline will produce a
metafunc-shiny/metafunc_results/ with a database file *.db within at the end of the run, based on results of analyses performed by MetaFunc.
The application may then be launched as follows:
If the run was done remotely, the user may first have to download the
metafunc-shinydirectory onto their local computerLaunch the
metafunc-shiny.Rprojin themetafunc-shinydirectory in Rstudio.Open the
app.Rfile in RStudio.Run the app in RStudio.
Explore results (see Display)
Viewing Results of Different Runs
To view different runs in the app, the user would have to ensure the following:
The database (
*.db) file is in the /data/ folder of the metafunc-app directory. Databases will be placed here automatically.In the home page of the app, select the database that corresponds to the run and press “Load Database”.
Display
The following tables are opened in the R Shiny Application and may be explored by the user:
Microbiome
R Shiny displays the following tables straight from the MetaFunc pipeline (Figure 3):
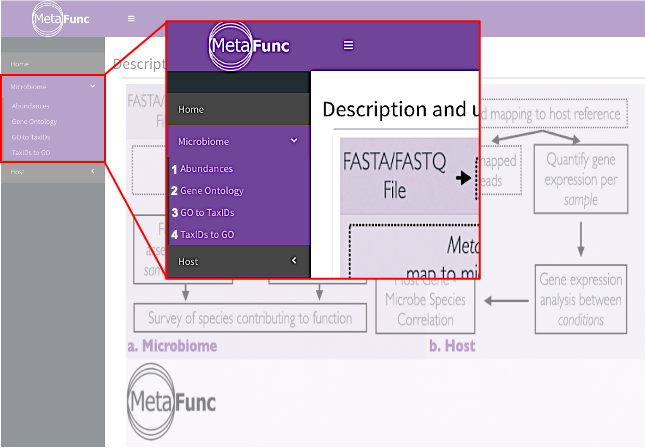
Fig. 3 R Shiny Microbiome Tables Generated
Taxonomy (DIR: analyses/results/microbiome/taxonomy)
1.1
per_sample/all_sptableScaled.tsv1.2
per_group/grouped_sptable_pct.tsv
At the top of the page, the user can toggle between Individual or Grouped samples (Figure 4, red box), and choose which columns to include in the view (Figure 4, green box). The user can also search for specific species (4, yellow box) and download the resulting table as .csv or excel file (4, blue box)
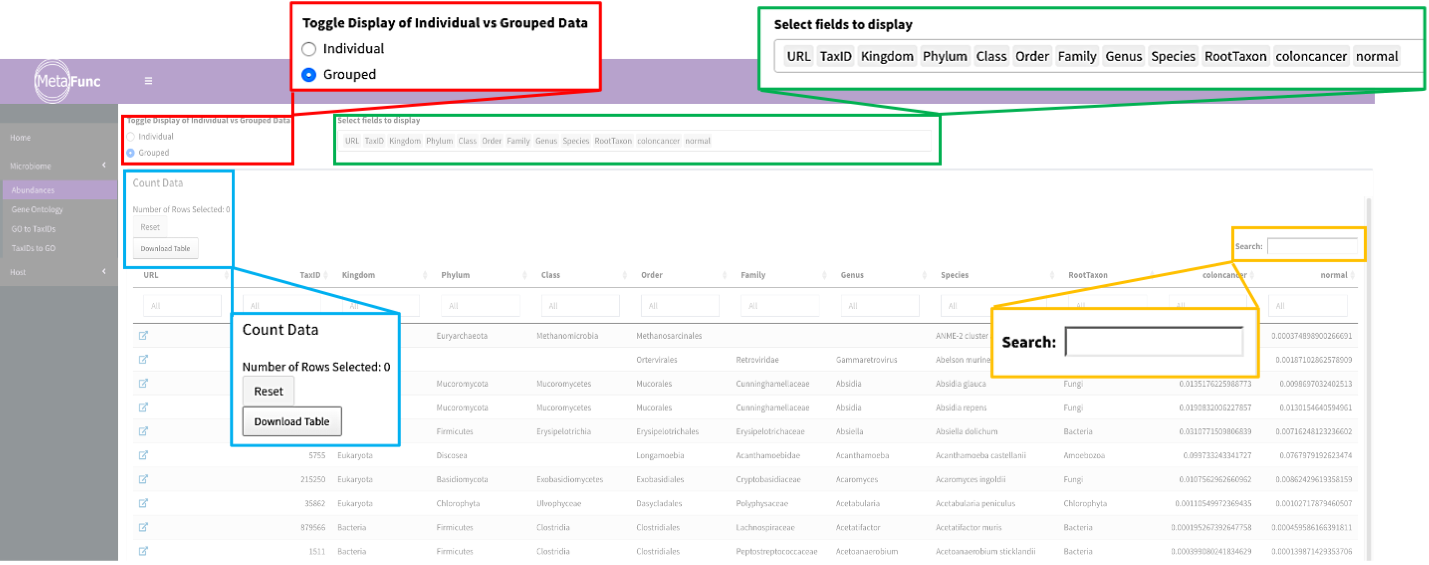
Fig. 4 R Shiny Microbiome Taxonomy Table Options
Function (DIR: analyses/results/microbiome/function)
2.1
per_sample/all_samples_goPercent.tsv2.2
per_group/all_grouped_goPercent.tsv
Similar to Taxonomic abundances, the user can also toggle between Individual or Grouped samples, choose which columns to include in the view, search for specific GO terms, and download resulting tables (same color boxes as Figure 4). In addition, the user would be able to choose among the following GO namespaces (Figure 5, purple box): Biological Process (BP), Molecular Function (MF), and Celluar Component (CC).
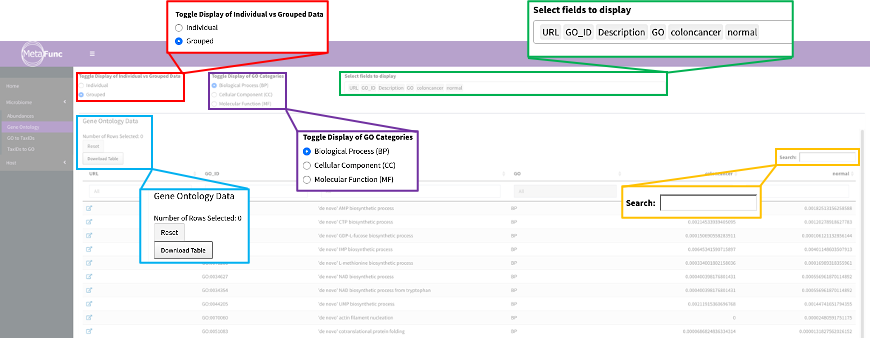
Fig. 5 R Shiny Microbiome GO Options
R Shiny also generates the following tables that link GOs to TaxIDs and vice versa (Figure 3):
GO to TaxIDs
The user can select one or more GO terms (Figure 6, upper box) and the MetaFunc R Shiny Application will provide the species who have proteins annotated with the GO(s) in question, with their corresponding abundances (Figure 6, lower box). Along with the viewing options described above, this page includes another toggle, Toggle Inclusivity Selection of TaxIDs (Figure 6, grey box) so users can choose to include either all the species that are annotated with any of GOs selected (In Any) or only the species annotated with all the GOs selected (Only in All). The resulting species table may also be downloaded as .csv or excel file.
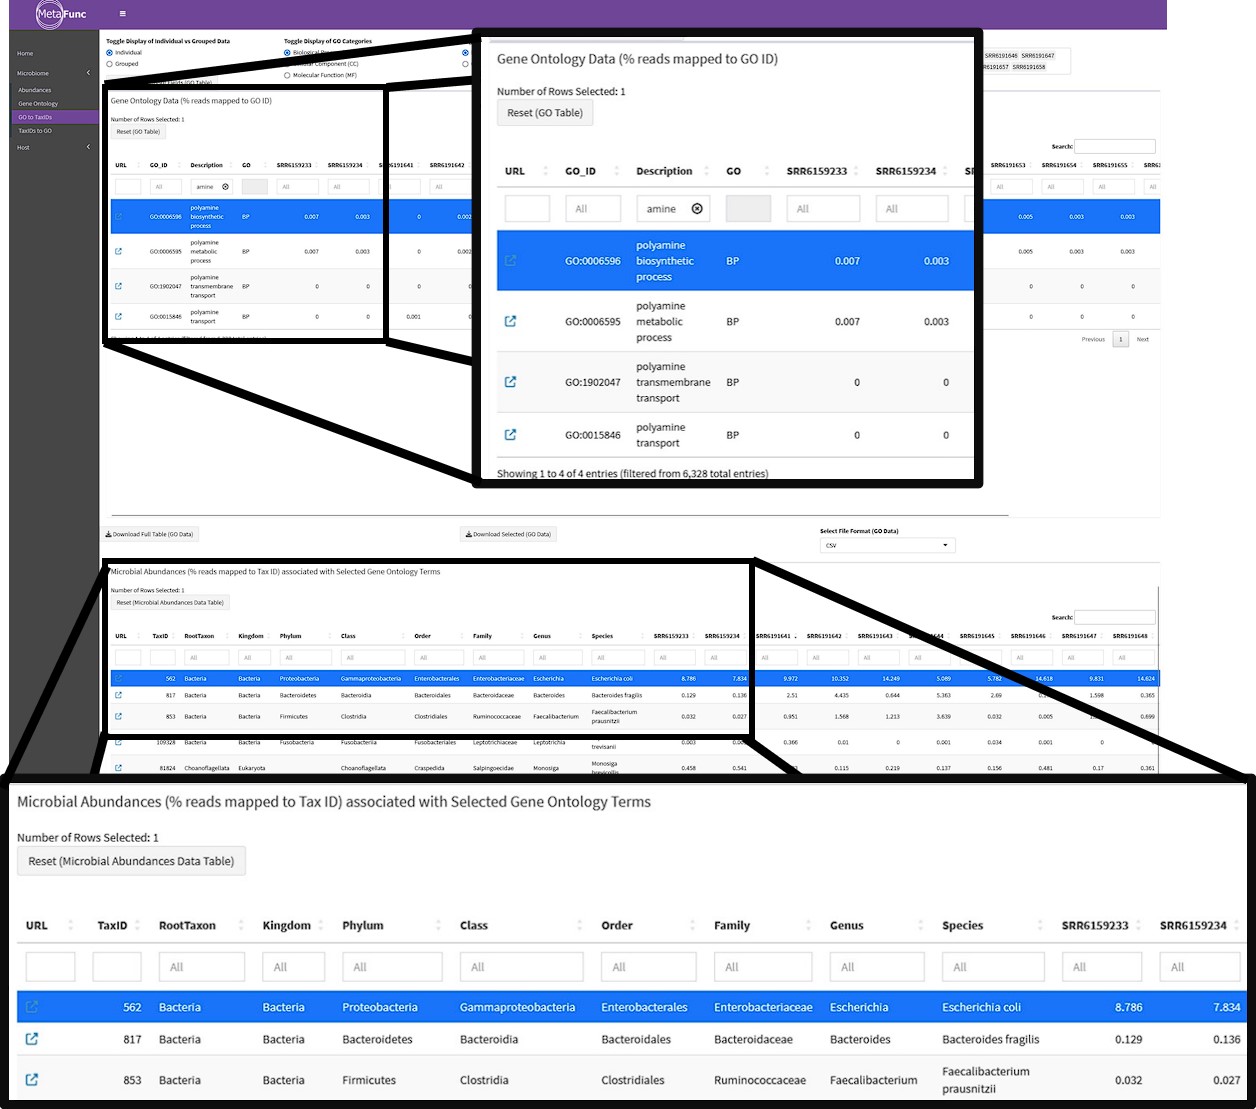
Fig. 6 R Shiny Microbiome GO to TaxID Example. GO selected is polyamine biosynthetic process and shown in the Figure are species with proteins annotated with the GO term.
TaxIDs to GOs
Conversely, the user can select one or more species (Figure 7, upper box) and the Metafunc R Shiny application will provide the GO terms annotating the proteins of the selected species, with their corresponding abundances (Figure 7, lower box).
The same viewing options as GO to TaxIDs are included. The resulting GO table may also be downloaded as .csv or excel file.
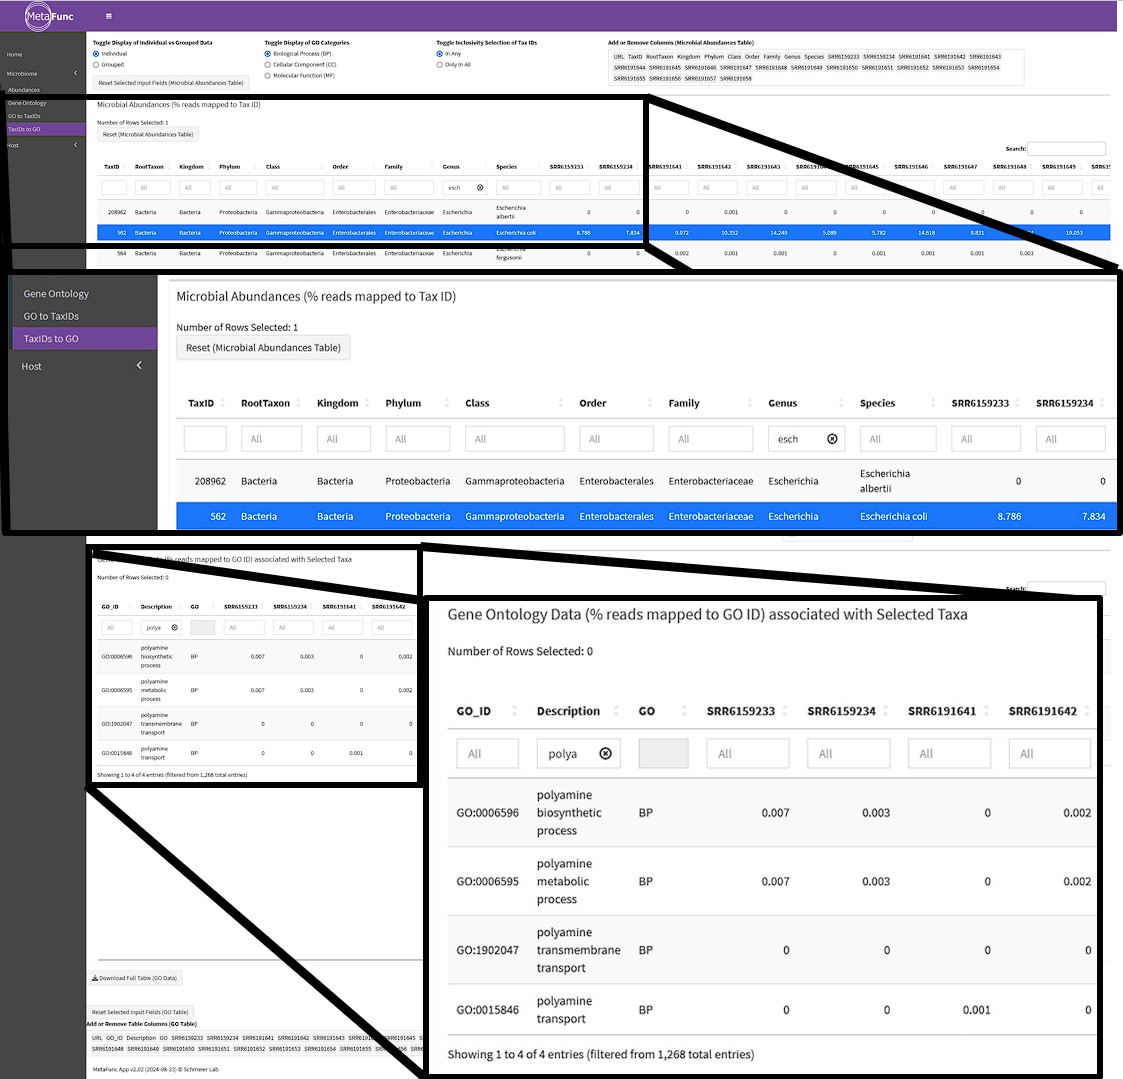
Fig. 7 R Shiny Microbiome TaxID to GO Example. Species selected is Bacteroides fragilis and shown in the Figure are GOs annotating the proteins of B. fragilis.
Host
R Shiny also displays host gene abundances as transcripts-per-million (Figures 8 and 9)
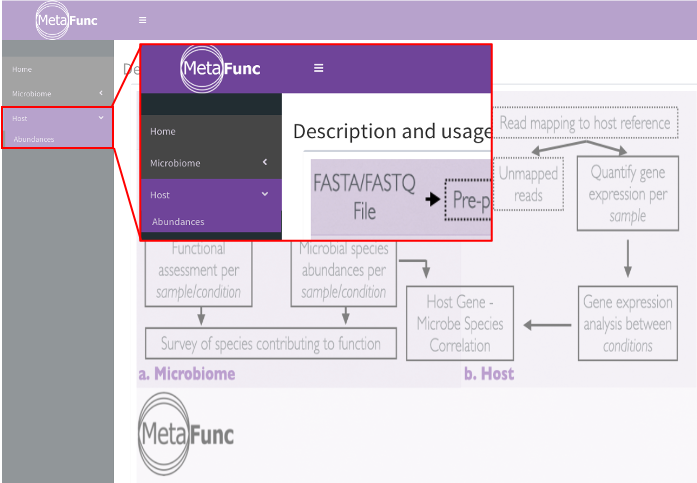
Fig. 8 R Shiny Host Table Generated
For the host table, the user can select which columns to include in the view (Figure 9, green box), search for specific genes (Figure 9, yellow box), and download the resulting table as .csv or excel file (Figure 9, blue box).
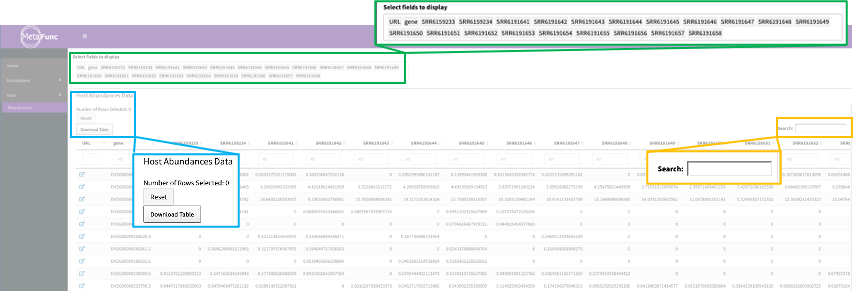
Fig. 9 R Shiny Host Table Options